
Monday, May 16, 2011
Niches of Birds at a Feeding Station (8B)
When observing the bird feeder, I saw no birds, only a few squirrels. Thus, I am unable to do the interpretation and analysis.

Microbial Communities on a Salt Concentration Gradient (9C)

- If you consider the series of increasingly saline solutions as a habitat gradient, how does your experiment compare with Whitaker's study of trees in the Great Smokey Mountains?
- This experiment compares with Whitaker's study in that we measured at regular intervals along a gradient, just as Whitaker did.
- Somewhere between no salt and the salt concentration of sea water, a freshwater protozoan will reach its tolerant limit, and the experimenter would not expect to see that species in more saline solutions. What would the Clements model predict for all the ranges of species in a microbial community sampled along this salt gradient? What would Gleason predict?
- Clements would predict that there is no overlap between the gradients while Gleason would predict overlap, going along with his continuum theme.
- Which model best represents your data? Explain.
- The Gleason model best represents the data because the same species was found in different infusions.
- If you had collected dried grass from a salt marsh near the sea as your source of culture medium and resting protozoans for this experiment, would you expect a different result from your series of infusions? Why?
- I would expect somewhat different results because even the spring water infusion would have salt in it because of the original salty environment.
- Early stages of hay infusions are dominated by bacteria; then protists that feed on bacteria tend to reduce bacterial populations. From the appearance and odor of your cultures, could you tell which tubes had the most robust bacterial populations? Although you cannot see bacteria well under a compound microscope, do you suspect different types may grow in different salt concentrations? Explain.
- I could not tell which cultures had the most bacteria because I did not smell them and they generally looked the same, although the seawater had more “muck” on it than the other infusions. I would suspect that different types of bacteria grow in different salt concentrations based on personal experience wherein I used salt water to clean out new piercings to prevent bacterial infections.

** Aidan Bailey and I did this lab together.
Geographic Information Systems (GIS)
GIS, or Geographic Information System, combines cartography with statistics and databases, allowing for an easy to understand interpretation of local data. It is beneficial to ecology in that it can provide information on land use, species, human population, habitat, and much more. GIS works to inform decision making. For our GIS project, we looked at Snowy Plover nests in Florida and the types of habitat they inhabit. This can be done for many species, and the used habitat can be overlapped with areas of human use in order to see how humans affect habitat usage by different species. Of course, this is just one of the many uses, and in my Conservation and Biodiversity class, we focused more on human use and how roads and urban areas affected surrounding habitat. GIS can also show you how an area changes over time.


Penny Lab
During one class we were given the assignment to make a boat that could hold as many pennies as possible without sinking. Through trial and error, many of the students realized that making a barge was the most effective method. When making a barge, my group, made of Lauren Ali, Aidan Bailey, and myself, first attempted reinforcing the bottom of the barge for fear that the weight would rip the bottom. However, this did not help, and having more surface area was the most important factor in the ship building process.


Dissolved Oxygen and Temperature (16A)


- Describe the shape of your standard curve. Is this relationship linear of curvilinear? Explain.
- The standard curve is curvilinear possibly because we used tap water instead of spring water, but more likely because the warmer water is, the faster the molecules are moving. The movement of molecules allows for more oxygen to diffuse at a faster rate. There may be some human errors that also modified the curve.
- If the oxygen is dissolved in cold water, what happens to the oxygen when water warms up? Have you ever observed this phenomenon?
- The oxygen increases and expands. I've observed this in boiling water which produces bubbles of gaseous oxygen.
- In your field site, how did the data compare with your standard curve? Was the water at this site saturated with oxygen, based on its temperature, or not? Explain other factors that may have affected oxygen levels, based on your observations.
- Our field samples did not compare to our standard curve at all. Only the water from the Sarasota Bay and from the toilet seemed to have oxygen saturation based on temperature. The other samples may have had different levels of interactions with vegetation than those samples that fit on the standard curve.
- How might the relationship between temperature and dissolved oxygen explain the adaptive significance of symbiotic algae within the bodies of coral polyps on tropical reefs?
- In tropical reefs warmer temperatures likely increase the amount of dissolved oxygen. This may enhance algae growth because algae consumes oxygen at night. Increased levels of oxygen also increase the success of coral polyps, which provide algae with needed carbon dioxide, thus further increasing the amount of dissolved oxygen in the water.
- Trapping of infrared radiation by carbon dioxide in the atmosphere has the potential to warm the atmosphere a few degrees over the next century. This does not seem very significant to a terrestrial mammal like yourself, but how might this change affect tropical aquatic habitats?
- This could affect tropical aquatic habitats by increasing the amount of dissolved oxygen in the water significantly. These increases will change the survival rates of all aquatic wildlife, from fish to algae to corals.

**Aidan Bailey and I worked together on this lab.
Sunday, May 15, 2011
Bird Diversity at the Beach
Lauren Ali, Aidan Bailey, Kelsey Hunt-Dolan, and I observed birds at North and South Lido beaches, focusing on diversity. We wanted to see if the number of people present impacted the bird species we saw at the beach. We scan sampled the people every five minutes, and constantly monitored and recorded the bird species present. We tried to go to the beach at the same time each day, around 3:30 PM so our data would be more consistent. We observed for half an hour. We chose these two sites because they both have sandy beach habitats, but South Lido has a more natural edge whereas North Lido is right next to St. Armands Circle. Our biggest problem was the possible misidentification of birds because some birds look very similar and most of us had little bird watching experience, especially Florida shore birds.

 Hypothesis: As the number of people present at the beach increases, we will see fewer bird species at the beach.
 Our results were found to be insignificant primarily because we did not have enough data. The outlier day we had also worked to skew our results. We saw the most birds on the day that we had the fewest people, and the fewest birds when we had 76 people. We saw 7 species when we had the highest number of people, showing two more species than on the day with our lowest observed diversity. On a day-to-day basis, we saw more people at North Lido than at South Lido. The most common species was the Laughing Gull, which is seen during every observation.
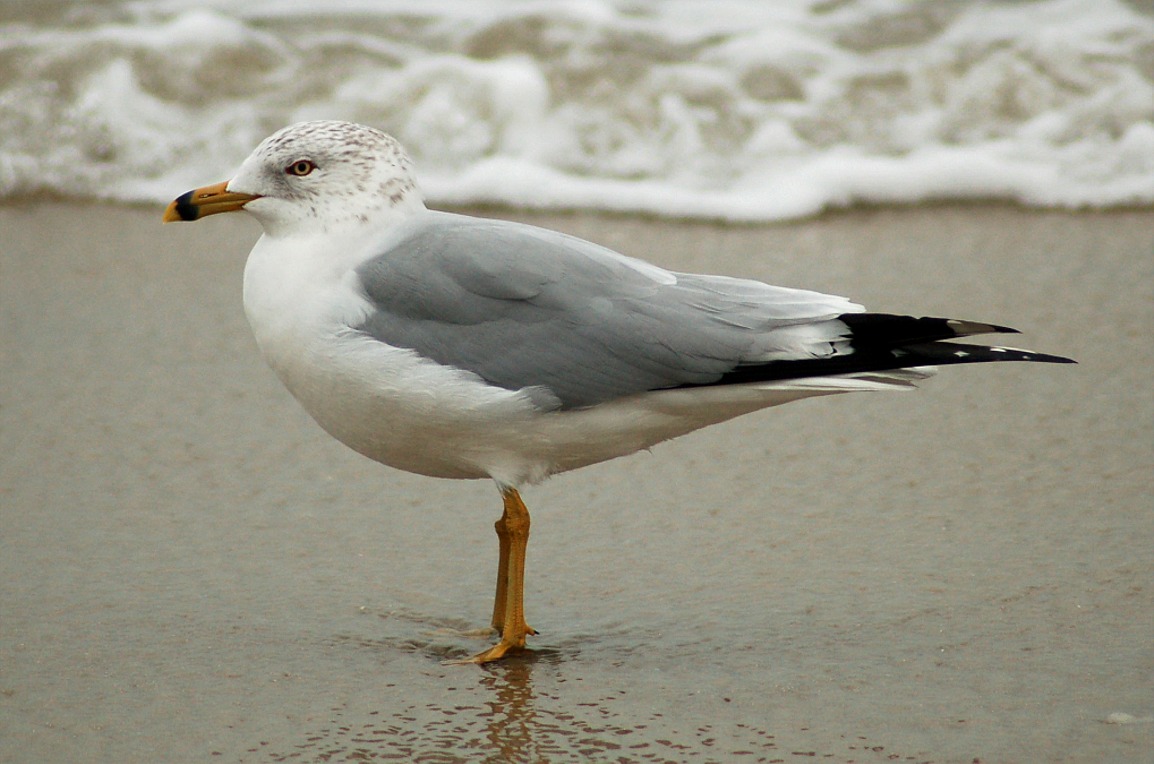
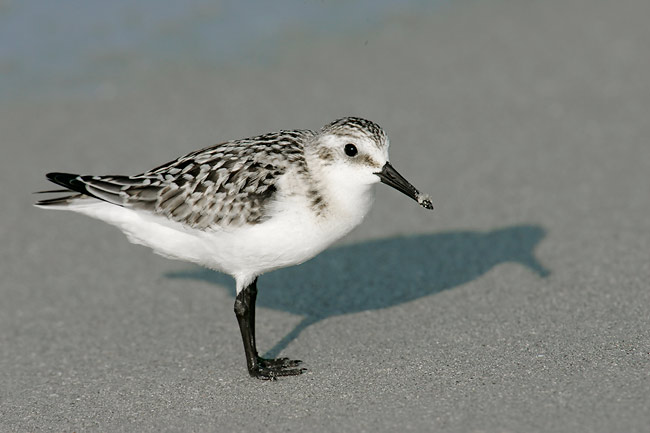
Species Observed: Laughing Gull, Herring Gull, Ring Billed Gull, Sanderling, Willet, Cormorant, Vulture, Crow, Brown Pelican, Least Tern, Royal Tern, Sandwich Tern, Common Tern, Great Blue Heron, Snowy Egret, White Ibis, American Golden Plover, Black Skimmer, Mocking Bird
**The first four were the most common and are picture below in the order listed.


Evaluation of Student Presentations
Cassie Wood and Vanessa Chastain
Their experiment was on whether or not the seawall affected seagrass growth in the Sarasota Bay. They provided a roadmap and captured my interest by presenting a hypothesis that may not have been true if the experiment had been done earlier in the life of the seawall. The content was well organized and easy to understand; however, Vanessa did stumble over her words a bit. The conclusions directly related to the topic, and they even provide a possible reason for why their hypothesis was correct. Overall the presentation was well organized and the presenters did a decent job, although eye contact was not as high as it could have been. They seemed to share the workload, each saying approximately equal amounts. A bibliography was included at the end.

Rachel Perry, Llyswen Berna, and Dan Monhollon
This experiment was on the biodiversity of leaf litter. The presentation had a lot of information, but did not seem to include any unnecessary details. The three presenters shared information equally, although the girls seemed to do more talking than Dan. It could just be that Dan talked more quietly than Llyswen and Rachel. It was clear that they had done background research because they knew what pH the soil should be and they knew that oak litter would be more moist than pine litter. They did a good job explaining how the Berlese funnel worked and gave logical reasons for the results they found. The presentation flowed well and the inclusion of the outlier was nice, but made their presentation a little bit longer than it should have been. None of the presenters had any mannerisms that I found distracting. Once more these presenters presented about equal amounts of information. A bibliography was included at the end.

Olivia Brockmeier, Katie Scussel, Sean Binninger, and Stephen Leatherman
This group discussed the invasive species of two different restored areas on campus. As hypothesized, there were fewer invasives on the recently restored site compared to the site restored about ten years ago. The reasoning they presented for this made sense, and they noted that they were unable to identify all species and that the newly restored site may be too young to have recognizable invasive species. They had done background research by asking knowledgeable staff about what they should expect to see in these two sites, and by using the Internet. Each person had a section to present, and the progression was well organized. The presentation could have included more pictures of the plants found and better delineation of which area the species were found in. Everyone presented roughly equal amounts of information, although it seemed that Sean talked a bit longer, however he did go last so this may have been an illusion. There were no distracting mannerisms, but there could have been more eye contact. A bibliography was included at the end and sources were mentioned throughout the presentation.

Oliver Peckham and Madi Verbeek
Oliver and Madi researched bay front trees and how they would be affected by sea level rise on campus. The presentation was well organized, beginning with methods and the number of trees, and progressing to three different scenarios for sea level rise, finishing with a discussion of which trees would be most impacted and how they might fair to submersion. There may have been a little bit too much numerical analysis, but otherwise the information they presented was both relevant and informative, providing listeners with some background information. They shared talking points equally and had a good presenting style, with nice volume and good eye contact. A bibliography was included at the end, giving merit to the conclusions they presented.

Monday, May 9, 2011
Finding the Deep Water Masses of the Atlantic Ocean (Activity 8)

Water Mass Abbreviations: NADW = North Atlantic Deep Water; MI = Mediterranean Intermediate ; SW = Surface Water; AAIW = Antarctic Intermediate Water ; AABW = Antarctic Bottom Water
Evaluation:
- If a person had a very long fishing line, why might it be possible to catch an Antarctic species of shark while fishing at the Equator?
- It may be possible to catch an Antarctic species of shark at the Equator with a very long fishing line because sharks could travel in Antarctic bottom water, which can sometimes be found at the Equator.
- Wind driven surface currents travel at approximately one kilometers per hour, while density driven deep ocean currents travel much slower, about one meter per hour. How long would it take Antarctic Bottom Water to travel to the North Atlantic sample site at 45°N, approximately 9,000 km from its Antarctic source area?
- Nine million hours, or 375,000 days, or 1,026.7 years.
- What relationships can you describe between water temperature and salinity at the 0° sample site?
- Salinity generally falls with temperature, although it increases between 5°C and 3°C.
- What happens to the water density at the 45°N sample site?
- Water density shows an overall increase with temperature declines at the 45°N site, although it does fall between 13°C and 10°C.
- From the Temperature-Density-Salinity Graph, what happens to the density of seawater at temperature increases? As the temperature decreases the density of the seawater does what?
- According to the graph, as temperature increases, density falls. As temperature decreases, density rises.
- What factor(s) increase sea surface water density at high latitudes?
- At Northern latitudes, the North Atlantic Gyre moves surface water clockwise, affecting density by changing water temperature and salinity.
- What factor(s) cause the density of the surface water in the low latitude regions to increase?
- At Southern latitudes, the South Atlantic Gyre moves surface water counter-clockwise, affecting density by changing water temperature and salinity. The sun also warms the water in lower latitudes.
- Explain why density driven circulation in the ocean depths is caused by the interaction of the atmosphere and the ocean.
- Atmospheric circulation works with oceanic circulation to distribute thermal energy along the earth's surface. Atmospheric winds enhance ocean currents and can produce spray, which causes salt to enter into the atmosphere. This reduces the salinity of the ocean, thus affecting density. Winds also produce waves which increases water movement and may modify temperature and/or salinity.
- Why is the sun considered the source of energy for driving the density circulation in ocean depths? Explain.
- The sun is considered the source of energy for driving density circulation because it increases lower latitude waters, forcing water to flow to the less dense Northern waters.
Where I Grew Up (Maps)


The USGS map for the area where I grew up, Knoxville, GA, has no symbols on it. It is essentially a satellite image with a grip placed on top. The topographic map of our property (we lived on a chicken farm of approximately 160 acres) shows the highest point at a hill in one of the fields; from experience, this seems correct. Although it was hard to determine the lowest point based on the graph, the lines seem to indicate what I would estimate to be the lowest point on our property, at the edges of our two ponds. I cannot think of an alternate way to mark the highest and lowest points than the method used by topographic maps unless you just put a point, which would not work for many areas. I've marked the two areas with red dots, although the lowest point includes more land than indicated by a dot.
Geological mapping is important because it provides a scientific base for conservation efforts and decision making. It does not appear as though the area in which I grew up has been geologically mapped, probably because it is a small, relatively rural town. It has a lot of natural areas, none of which are protected. The town is likely not large enough to require geological mapping.
Comparing Exponential and Logistical Growth (4B)


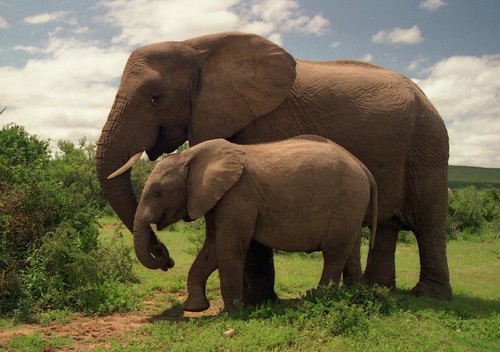
- Compare the tables for Addo Elephants in this exercise with the table at the beginning of the Introduction of Darwin's hypothetical elephants. Was Darwin as conservative in his calculations for reproductive rates as he claimed to be?
- Using the data provided for year 40, Darwin was conservative in his calculations. He predicted the population to triple, and if you average out the predicted size from the exponential and logistic models, that is about what happens. However, the logistic model does predict a slower growth rate, so Darwin was not ridiculously conservative.
- If the Addo elephants do eventually reach carrying capacity, what factors might limit further growth of the population? As a park manager trying to maintain biodiversity and ecosystem health, would you prefer to limit population growth at some point below carrying capacity? Explore some of the practical and ethical issues involved.
- The most limiting factors, especially in a park, are space and resources. Elephants are large creatures who take up a large amount of space and who consume pounds and pounds of vegetation. They also have no natural predators, although hunting can be an issue. As a park manager, I may want to limit elephant populations to a level below carrying capacity in order to promote biodiversity, because elephants consume much of an area's natural resources. It may be impractical to cull elephant populations because the animals are so large. Ethical issues surrounding what to do with the removed elephants also arise. Killing animals is seen by many to be wrong, but if the extra elephants are not killed, where should they be relocated? Putting wild animals in zoos is also seen as unethical. There are also issues with translocating elephants because of the complex social structure; they may not embrace new individuals.
- Since we really do not know what K is for Addo Elephant park, we presumed a carrying capacity of 500 for the purpose of this exercise. How might you determine a more realistic value for K in a field study of these animals?
- In a field study of these animals, it would be necessary to determine the amount of space each elephant requires, and the amount of food and water in consumes in order to determine an accurate carrying capacity of the park. Water, food, and space are the most limiting factors, so elephant's use of these factors should be monitored in order to determine a more realistic carrying capacity.
- Thomas Malthus was concerned that the global human population was growing exponentially, doubling every 50 years or less, and that we would eventually outgrow our food supply. What scientific advances since 1798 have altered r and increased K for human beings? Have these technologies actually solved the problems, or just postponed the famine Malthus was concerned about?
- Advancements in agriculture, technology, and medicine have altered r and increased K for human beings. Agricultural advancements have made large-scale farms possible and have increased the availability of food. The discovery of electricity, the creation of the automobile, and the invention of modern appliances all worked to increase K by making it easier to get, store, and cook food. Medicinal advances, both those that fight illness as well as contraception, alter r by increasing life expectancy and allowing humans to change birth rates. These technologies have not solved our problems, they've just postponed Malthus' famine, by temporarily increasing the carrying capacity of Earth. We will soon run out of vital resources, causing a significant decline in population to a number that the planet can actually sustain.
- The global human population is over 6 billion and still climbing. What do you think the global carrying capacity might be for humans? Consider agricultural production as a possible limiting resources, but also fresh water, regeneration of oxygen by plants, energy, minerals, and cultural factors. How might our lifestyle choices and diet affect the maximum number of people the earth can sustain?
- Ignoring technological advances, I think the global carrying capacity for humans is around what the population was prior to the industrial revolution, around two or three billion people. Including technology, I would estimate it to be around four billion people. I present these numbers as sustainable populations sizes that can continue indefinitely without degrading human life, in a world where all people had equal impact on the earth. Many people in developed countries live in a manner that would require multiple Earths to support them; they can only continue in this manner because people in undeveloped countries have much smaller impacts on the planet. Our use of technology consumes absurd amounts of resources in order to feed us, and consumes many sources of energy in order to allow us to live our upper-middle class lifestyles. Large-scale agriculture consumes giant swaths of land and huge amounts of water, reducing fresh water and oxygen regeneration. If people lived simpler lives and ate locally, we could live on a healthy planet with vast natural areas. I would estimate the population size at which the earth can absolutely no longer support us to be around 10 billion.
- Ignoring technological advances, I think the global carrying capacity for humans is around what the population was prior to the industrial revolution, around two or three billion people. Including technology, I would estimate it to be around four billion people. I present these numbers as sustainable populations sizes that can continue indefinitely without degrading human life, in a world where all people had equal impact on the earth. Many people in developed countries live in a manner that would require multiple Earths to support them; they can only continue in this manner because people in undeveloped countries have much smaller impacts on the planet. Our use of technology consumes absurd amounts of resources in order to feed us, and consumes many sources of energy in order to allow us to live our upper-middle class lifestyles. Large-scale agriculture consumes giant swaths of land and huge amounts of water, reducing fresh water and oxygen regeneration. If people lived simpler lives and ate locally, we could live on a healthy planet with vast natural areas. I would estimate the population size at which the earth can absolutely no longer support us to be around 10 billion.

Sunday, May 8, 2011
Needle Length in Conifers (1B)


Questions:
- In comparing your histogram to the description of a normal distribution, did you seem to get a fairly good fit to the bell-shaped curve, or did you notice a different pattern? Describe these differences: was the histogram bimodal? Skewed? Flattened or sharply peaked? If you performed statistical tests using these data, would you be comfortable using parametric statistics, or would you seek a non-parametric alternative? Do you think you made enough measurements to make a certain judgment on this question, or for you think more data may be needed?
- The histogram did not fit the bell-shaped curve very well; it was more skewed than anything, but still did not fit that description well. It was somewhat flat, with a very high peak at the 22.0-22.5 cm range, which is the middle point. I don't think I would be very comfortable using parametric statistics because most of the data falls to the right of the peak, with only 19 needles (less than 25%) shorter than 22.0 cm. I feel as though I made enough measurements, especially when comparing my data to information available about needle length for this species of tree.
- The mean, median, and mode are three different statistical approaches to describe the “typical” individual in a population. Based on your data, does it matter very much which of these three statistics is used? Explain how this answer is related to your answer for the previous question.
- Between mean (23.6 cm) and median (23.8 cm), it matters little which is used; they are only a fifth of an inch apart. However, the mode (26 cm) is significantly larger than both numbers. This relates to question one because it shows that the data does not fall in a bell shape.
- What do the variance, S.E., or standard deviation estimates tell you about your population that the mean does not tell you? Why is it important to report some measure of variation, along with the sample size, whenever you report a calculated mean?
- The standard deviation estimates tell us the range of the needles lengths, whereas the mean only tells us the average needle length. It is important to report variation and sample size because it gives the reader a general idea of the different needle lengths and can help them determine how accurate the data collected is.
- How would you design experiments to determine the importance of this trait in determining survival and reproduction? How would you test the extent to which this trait is heritable?
- The needles/leaves of trees are very important for survival because they aid in the creation of energy. I would test the importance of needle length on survival by measuring needle lengths from many trees of the same age and seeing if height and girth relate. I am assuming that the bigger a tree, the better fit it is. I would test its significance to reproduction by measuring the amount of seeds produced from trees of the same age compared to the length of the needles. I would be assuming that the trees I am experimenting on are at a reproductive age, and that the same percentage of seeds from each tree will be fertilized and will grow into a new tree. I would test how heritable the trait is by planting seeds from trees of the same age with different needle lengths and seeing how long the needles of the offspring grow to be.
**Aidan Bailey and Lauren Ali worked with me.

Estimating Ecological Efficiency of Leaf Miners (17C)

Questions:
- Relate the concept of ecological efficiency, as measured in this exercise, with the trophic pyramid illustrated in Figure 17.3. What would the trophic pyramid look like for leaves and leaf miners?
- Leaves would be the producers, and the miners would be the primary consumers.
- What kind of measurements would you need to base your efficiency calculation on kcal of energy in the insect vs. kcal of energy in the leaf tissue it ate?
- You would need to know the amount of energy it takes a miner to eat a defined area of leaf, and you would need to know the amount of kcals in a specified area of the leaf.
- How would you expect ecological efficiency of a leaf miner to compare with the efficiency of an adult leaf-eating beetle flying from branch to branch and chewing on the same kinds of leaves? Explain.
- I would expect the efficiency of the adult to be higher because they consume the entire portion of the leaf whereas miners consume the interior of the leaf only. Adults likely eat more leaves than miners, too.
- Explain how the second law of thermodynamics applies to the ecological efficiency of leaf miners.
- The second law of thermodynamics states that “the entropy of the universe increases during any spontaneous process” (http://entropysite.oxy.edu/students_approach.html). Entropy measures the dispersal of energy. It is not possible to consume energy without expending some amount of energy. The ecological efficiency of leaf miners works to portray the amount of energy consumed by a miner versus the amount it expends, related to the area in which it directly receives and expends its energy.
- Do you think a leaf miner qualifies as an herbivore or a parasite? On what basis would you make a distinction between these categories?
- I think a leaf miner is and herbivore and a endoparasite in that parasites consume the interior of their habitat, the leaf, yet leaf miners eat leaves, which is an herbivorous characteristic.
**Aidan Bailey and I worked together on this lab.

Friday, May 6, 2011
Calculating “r” from a Published Data Set (4A)

I calculated the r value to be .378 (using data points 1985, 5.4 and 1994, 8.8). As this number is larger than zero, it indicates that the Egyptian goose population in the Netherlands has been growing (their birth rate exceeds their death rate), and will continue to do so. It is likely that something will end up limiting the growth of these geese, be it predators or competitors. Eventually the population should reach a stable size near the carrying capacity of the habitat.


Questions:
- In the exponential population growth equation, Nt=N0(ert), identify what each of the symbols stands for and explain whether it is a variable or a constant.
- Nt is the population at the time you choose; it is a variable. N0 is the initial population; it is a constant. “e” is a mathematical constant equal to about 2.718. “r” is the intrinsic rate of growth of a population and is constant. “t” stands for time which is variable.
- Use the value of r you calculated to project the number of geese in 1994. Does the calculated number approximate the number actually observed in 1994? Explain any discrepancies you encounter.
- The population estimate for 1994 using the equation is 7,776. This is higher than the observed number. This may be because the habitat is reaching its carrying capacity, or it could be a result of human error in the collection of data. It may also be caused by an increase in predation as the community adjusts to the insertion of the geese.
- Why is the method used for calculating r more reliable than choosing two points from the data table?
- The method we used is better because two points on the table may not fall directly on the line of best fit. The line of best fit is a better representation of the overall pattern than any two points on the data table.
- Why do you think Egyptian goose populations are increasing exponentially in the Netherlands, but not in Africa where they originated.
- The Netherlands likely has more available habitat and fewer natural predators than the native habitat in Africa.
- Can you name an example of an exotic species that has become an ecological problem in North America, and explain why this species is an ecological threat?
- The Brazilian Pepper tree, found in Florida, is an introduced species that is an ecological threat because it spread rapidly and overpowered mangroves, which are an important species in Florida, and can invade mature canopies, choking out most other plants.

Size and Shape of [Palm] Trees (2C)


- From your graph, does the height of the tree show a correlation with the diameter of the stem? Is the relationship linear or curvilinear? Interpret this result.
- The height of the tree shows an overall linear correlation to the diameter of the trunk; however, there are a few trees that fall quite far from the line of best fit. We measured multiple species of palm trees, but did not note which species each tree was. We do know that most of the trees were of one species, so the outliers were likely trees of a different species. The majority of our trees were likely Bismarck Palms.
- In animals, the strength supporting bone is related to the cross-sectional area of the bone. This results in different proportions for legs of heavy animals as seen in Figure 2.6. Do you see a similar trend in larger trees, which bear a proportionately heavier weight?
- I do see a similar trend for most trees, although not all of them. This may be because we measured different types of palm trees.
- If the strength of a tree trunk is proportional to its cross-sectional area, and weight of a tree is related to its volume, then what powers of your measurement variables (diameter and height) would be expected to yield a straight line on the above graph?
- Half of the diameter (the radius) squared, multiplied by the height, would give you the volume of the tree trunk. The cross-sectional area can be calculated by squaring the radius and multiplying it by pi (3.14).
- Using the tangent to measure the height of a tree is a classic application of trigonometry in a field study. Find a definition of the tangent. Why was this function used rather than a sine or cosine in our procedure?
- The tangent is defined as the “ratio of the opposite to the adjacent side of a right-angled triangle” (wordnetweb.princeton.edu/perl/webwn). This function was used opposed to sine or cosine because both of those functions require knowing the height of the tree in order to make the calculation, and if we knew the height, we wouldn't need to do a calculation at all.
- Past extreme weather, proximity to other trees (especially non-palms), proximity to concrete, and species of the tree may have affected the height and diameter of the trees. It is likely that extreme weather had the most impact on my data set because most of the trees were quite close to concrete walkways, and some of the trees were curved near the top, likely as a result of high winds when the tree was young. While proximity to other trees likely had an impact, it doesn't seem significant as most of the trees were quite close to other trees, whether palm or not. These secondary factors could skew my results to numbers that are lower than expected from the species.
** Aidan Bailey and I worked together on this lab.

Competition Problems (10C)
- Draw a joint abundance graph, with Lotka-Volterra isoclines consistent with the results of competition in the experiment on Paramecium illustrated in Figure 10.4.

- Assume the maximum density of harvester ants in a desert region is eight colonies per hectare in the absence of honeypot ants. Five colonies of honeypot ants move into the area, and as a result of interference competition, the number of harvester ant colonies falls to six colonies per hectare. What is the competition coefficient representing the effect of honeypot colonies on harvester colonies
- The competition coefficient is 0.4
- Use the Lotka-Volterra equations to predict the equilibrium population sizes of these two competing species, elk and bison, in a Kansas prairie reserve. Draw a joint abundance graph with isoclines to illustrate your answer.

- The equilibrium populations are predicted to be 54 bison and 103 elk.
- In the Kansas preserve described in problem 3, if the bison herd is culled every year and maintained at a constant number of 50 individuals by the park staff, predict the equilibrium number of elk. Explain your answer by referencing isoclines on the joint abundance graph.
- I predict the number of elk to be 126 using the competition coefficient of bison on elk (.45) and multiplying it by 50, and then adding that number (22.5) to the equilibrium number of elk (103.5).
- Assume that Species 1 (cattails) and Species 2 (rushes) compete for space around a pond in such a way that K1= 80 shoots per m2 and K2= 115 shoots per m2. Competition coefficients are α= 0.8 and β= 1.6, indicating a high level of niche overlap. Draw a joint abundance graph with isoclines, adding arrows to indicate the direction of change within each area of your graph. In theory, if the populations were at the point of intersection of the two isoclines in your drawing, both cattails and rushes would demonstrate zero growth, and the system would be in equilibrium. Is the population likely to remain at this point? What biological factors might determine the actual outcome for this pond?

- The population is unlikely to remain at this point because cattails and rushes probably have different reproductive patterns, which may give one of them an advantage over the other. Growth rates may play a role in determining the outcome for the pond if one species grows faster, taking up more space and possibly creating more shade, which could hurt the other species.


Subscribe to:
Posts (Atom)