
Monday, May 16, 2011
Niches of Birds at a Feeding Station (8B)
When observing the bird feeder, I saw no birds, only a few squirrels. Thus, I am unable to do the interpretation and analysis.

Microbial Communities on a Salt Concentration Gradient (9C)

- If you consider the series of increasingly saline solutions as a habitat gradient, how does your experiment compare with Whitaker's study of trees in the Great Smokey Mountains?
- This experiment compares with Whitaker's study in that we measured at regular intervals along a gradient, just as Whitaker did.
- Somewhere between no salt and the salt concentration of sea water, a freshwater protozoan will reach its tolerant limit, and the experimenter would not expect to see that species in more saline solutions. What would the Clements model predict for all the ranges of species in a microbial community sampled along this salt gradient? What would Gleason predict?
- Clements would predict that there is no overlap between the gradients while Gleason would predict overlap, going along with his continuum theme.
- Which model best represents your data? Explain.
- The Gleason model best represents the data because the same species was found in different infusions.
- If you had collected dried grass from a salt marsh near the sea as your source of culture medium and resting protozoans for this experiment, would you expect a different result from your series of infusions? Why?
- I would expect somewhat different results because even the spring water infusion would have salt in it because of the original salty environment.
- Early stages of hay infusions are dominated by bacteria; then protists that feed on bacteria tend to reduce bacterial populations. From the appearance and odor of your cultures, could you tell which tubes had the most robust bacterial populations? Although you cannot see bacteria well under a compound microscope, do you suspect different types may grow in different salt concentrations? Explain.
- I could not tell which cultures had the most bacteria because I did not smell them and they generally looked the same, although the seawater had more “muck” on it than the other infusions. I would suspect that different types of bacteria grow in different salt concentrations based on personal experience wherein I used salt water to clean out new piercings to prevent bacterial infections.

** Aidan Bailey and I did this lab together.
Geographic Information Systems (GIS)
GIS, or Geographic Information System, combines cartography with statistics and databases, allowing for an easy to understand interpretation of local data. It is beneficial to ecology in that it can provide information on land use, species, human population, habitat, and much more. GIS works to inform decision making. For our GIS project, we looked at Snowy Plover nests in Florida and the types of habitat they inhabit. This can be done for many species, and the used habitat can be overlapped with areas of human use in order to see how humans affect habitat usage by different species. Of course, this is just one of the many uses, and in my Conservation and Biodiversity class, we focused more on human use and how roads and urban areas affected surrounding habitat. GIS can also show you how an area changes over time.


Penny Lab
During one class we were given the assignment to make a boat that could hold as many pennies as possible without sinking. Through trial and error, many of the students realized that making a barge was the most effective method. When making a barge, my group, made of Lauren Ali, Aidan Bailey, and myself, first attempted reinforcing the bottom of the barge for fear that the weight would rip the bottom. However, this did not help, and having more surface area was the most important factor in the ship building process.


Dissolved Oxygen and Temperature (16A)


- Describe the shape of your standard curve. Is this relationship linear of curvilinear? Explain.
- The standard curve is curvilinear possibly because we used tap water instead of spring water, but more likely because the warmer water is, the faster the molecules are moving. The movement of molecules allows for more oxygen to diffuse at a faster rate. There may be some human errors that also modified the curve.
- If the oxygen is dissolved in cold water, what happens to the oxygen when water warms up? Have you ever observed this phenomenon?
- The oxygen increases and expands. I've observed this in boiling water which produces bubbles of gaseous oxygen.
- In your field site, how did the data compare with your standard curve? Was the water at this site saturated with oxygen, based on its temperature, or not? Explain other factors that may have affected oxygen levels, based on your observations.
- Our field samples did not compare to our standard curve at all. Only the water from the Sarasota Bay and from the toilet seemed to have oxygen saturation based on temperature. The other samples may have had different levels of interactions with vegetation than those samples that fit on the standard curve.
- How might the relationship between temperature and dissolved oxygen explain the adaptive significance of symbiotic algae within the bodies of coral polyps on tropical reefs?
- In tropical reefs warmer temperatures likely increase the amount of dissolved oxygen. This may enhance algae growth because algae consumes oxygen at night. Increased levels of oxygen also increase the success of coral polyps, which provide algae with needed carbon dioxide, thus further increasing the amount of dissolved oxygen in the water.
- Trapping of infrared radiation by carbon dioxide in the atmosphere has the potential to warm the atmosphere a few degrees over the next century. This does not seem very significant to a terrestrial mammal like yourself, but how might this change affect tropical aquatic habitats?
- This could affect tropical aquatic habitats by increasing the amount of dissolved oxygen in the water significantly. These increases will change the survival rates of all aquatic wildlife, from fish to algae to corals.

**Aidan Bailey and I worked together on this lab.
Sunday, May 15, 2011
Bird Diversity at the Beach
Lauren Ali, Aidan Bailey, Kelsey Hunt-Dolan, and I observed birds at North and South Lido beaches, focusing on diversity. We wanted to see if the number of people present impacted the bird species we saw at the beach. We scan sampled the people every five minutes, and constantly monitored and recorded the bird species present. We tried to go to the beach at the same time each day, around 3:30 PM so our data would be more consistent. We observed for half an hour. We chose these two sites because they both have sandy beach habitats, but South Lido has a more natural edge whereas North Lido is right next to St. Armands Circle. Our biggest problem was the possible misidentification of birds because some birds look very similar and most of us had little bird watching experience, especially Florida shore birds.

 Hypothesis: As the number of people present at the beach increases, we will see fewer bird species at the beach.
 Our results were found to be insignificant primarily because we did not have enough data. The outlier day we had also worked to skew our results. We saw the most birds on the day that we had the fewest people, and the fewest birds when we had 76 people. We saw 7 species when we had the highest number of people, showing two more species than on the day with our lowest observed diversity. On a day-to-day basis, we saw more people at North Lido than at South Lido. The most common species was the Laughing Gull, which is seen during every observation.
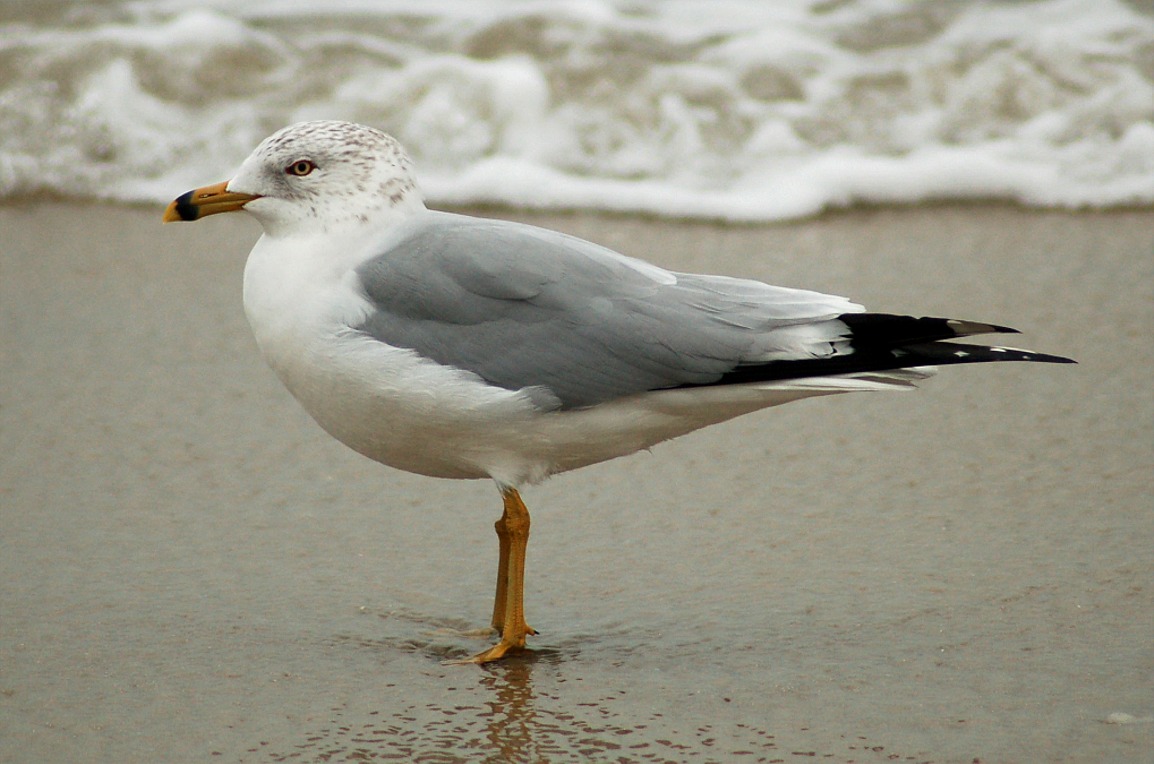
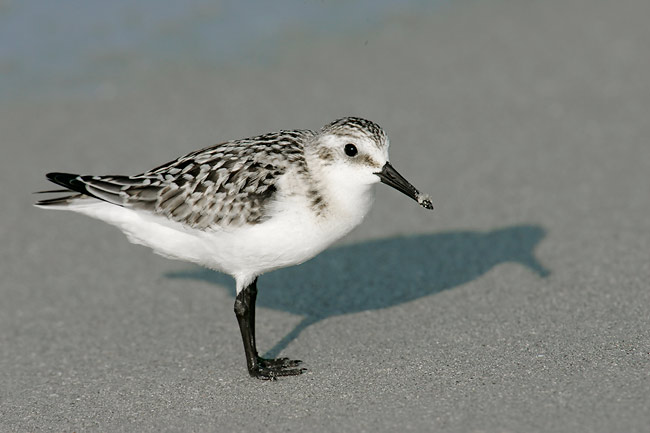
Species Observed: Laughing Gull, Herring Gull, Ring Billed Gull, Sanderling, Willet, Cormorant, Vulture, Crow, Brown Pelican, Least Tern, Royal Tern, Sandwich Tern, Common Tern, Great Blue Heron, Snowy Egret, White Ibis, American Golden Plover, Black Skimmer, Mocking Bird
**The first four were the most common and are picture below in the order listed.


Evaluation of Student Presentations
Cassie Wood and Vanessa Chastain
Their experiment was on whether or not the seawall affected seagrass growth in the Sarasota Bay. They provided a roadmap and captured my interest by presenting a hypothesis that may not have been true if the experiment had been done earlier in the life of the seawall. The content was well organized and easy to understand; however, Vanessa did stumble over her words a bit. The conclusions directly related to the topic, and they even provide a possible reason for why their hypothesis was correct. Overall the presentation was well organized and the presenters did a decent job, although eye contact was not as high as it could have been. They seemed to share the workload, each saying approximately equal amounts. A bibliography was included at the end.

Rachel Perry, Llyswen Berna, and Dan Monhollon
This experiment was on the biodiversity of leaf litter. The presentation had a lot of information, but did not seem to include any unnecessary details. The three presenters shared information equally, although the girls seemed to do more talking than Dan. It could just be that Dan talked more quietly than Llyswen and Rachel. It was clear that they had done background research because they knew what pH the soil should be and they knew that oak litter would be more moist than pine litter. They did a good job explaining how the Berlese funnel worked and gave logical reasons for the results they found. The presentation flowed well and the inclusion of the outlier was nice, but made their presentation a little bit longer than it should have been. None of the presenters had any mannerisms that I found distracting. Once more these presenters presented about equal amounts of information. A bibliography was included at the end.

Olivia Brockmeier, Katie Scussel, Sean Binninger, and Stephen Leatherman
This group discussed the invasive species of two different restored areas on campus. As hypothesized, there were fewer invasives on the recently restored site compared to the site restored about ten years ago. The reasoning they presented for this made sense, and they noted that they were unable to identify all species and that the newly restored site may be too young to have recognizable invasive species. They had done background research by asking knowledgeable staff about what they should expect to see in these two sites, and by using the Internet. Each person had a section to present, and the progression was well organized. The presentation could have included more pictures of the plants found and better delineation of which area the species were found in. Everyone presented roughly equal amounts of information, although it seemed that Sean talked a bit longer, however he did go last so this may have been an illusion. There were no distracting mannerisms, but there could have been more eye contact. A bibliography was included at the end and sources were mentioned throughout the presentation.

Oliver Peckham and Madi Verbeek
Oliver and Madi researched bay front trees and how they would be affected by sea level rise on campus. The presentation was well organized, beginning with methods and the number of trees, and progressing to three different scenarios for sea level rise, finishing with a discussion of which trees would be most impacted and how they might fair to submersion. There may have been a little bit too much numerical analysis, but otherwise the information they presented was both relevant and informative, providing listeners with some background information. They shared talking points equally and had a good presenting style, with nice volume and good eye contact. A bibliography was included at the end, giving merit to the conclusions they presented.

Subscribe to:
Posts (Atom)